
Customer service metrics are tools that help you make informed decisions, optimize your business strategies, and ensure you’re always delivering exceptional support. Statistics show that effective customer service is directly linked to an observable increase in sales for 64% of businesses.

This blog article aims to equip you with essential knowledge about customer service metrics. It should enable you to enhance customer experience and elevate your business by tracking and leveraging the 17 most crucial metrics in 2023.
Understanding customer service metrics
Customer service metrics measure the performance of a business in keeping its customers happy. They can include things like:
- How quickly the support team answers customer calls
- How satisfied customers are after an interaction
- How many issues are resolved on the first contact
These measurements help a business understand if it is meeting its customers’ expectations and identify areas for improvement.
There are two main categories of customer service metrics.
- Operational metrics: They focus on day-to-day activities and how efficiently the customer service team handles tasks.
- Organizational metrics: They zoom out to the bigger picture, assessing how customer service aligns with the business goals.
📊 Both customer service metric categories are equally important. Striking a balance between their measurements is paramount for ensuring the optimal performance of the support process.
Infographic: Top 17 customer service metrics
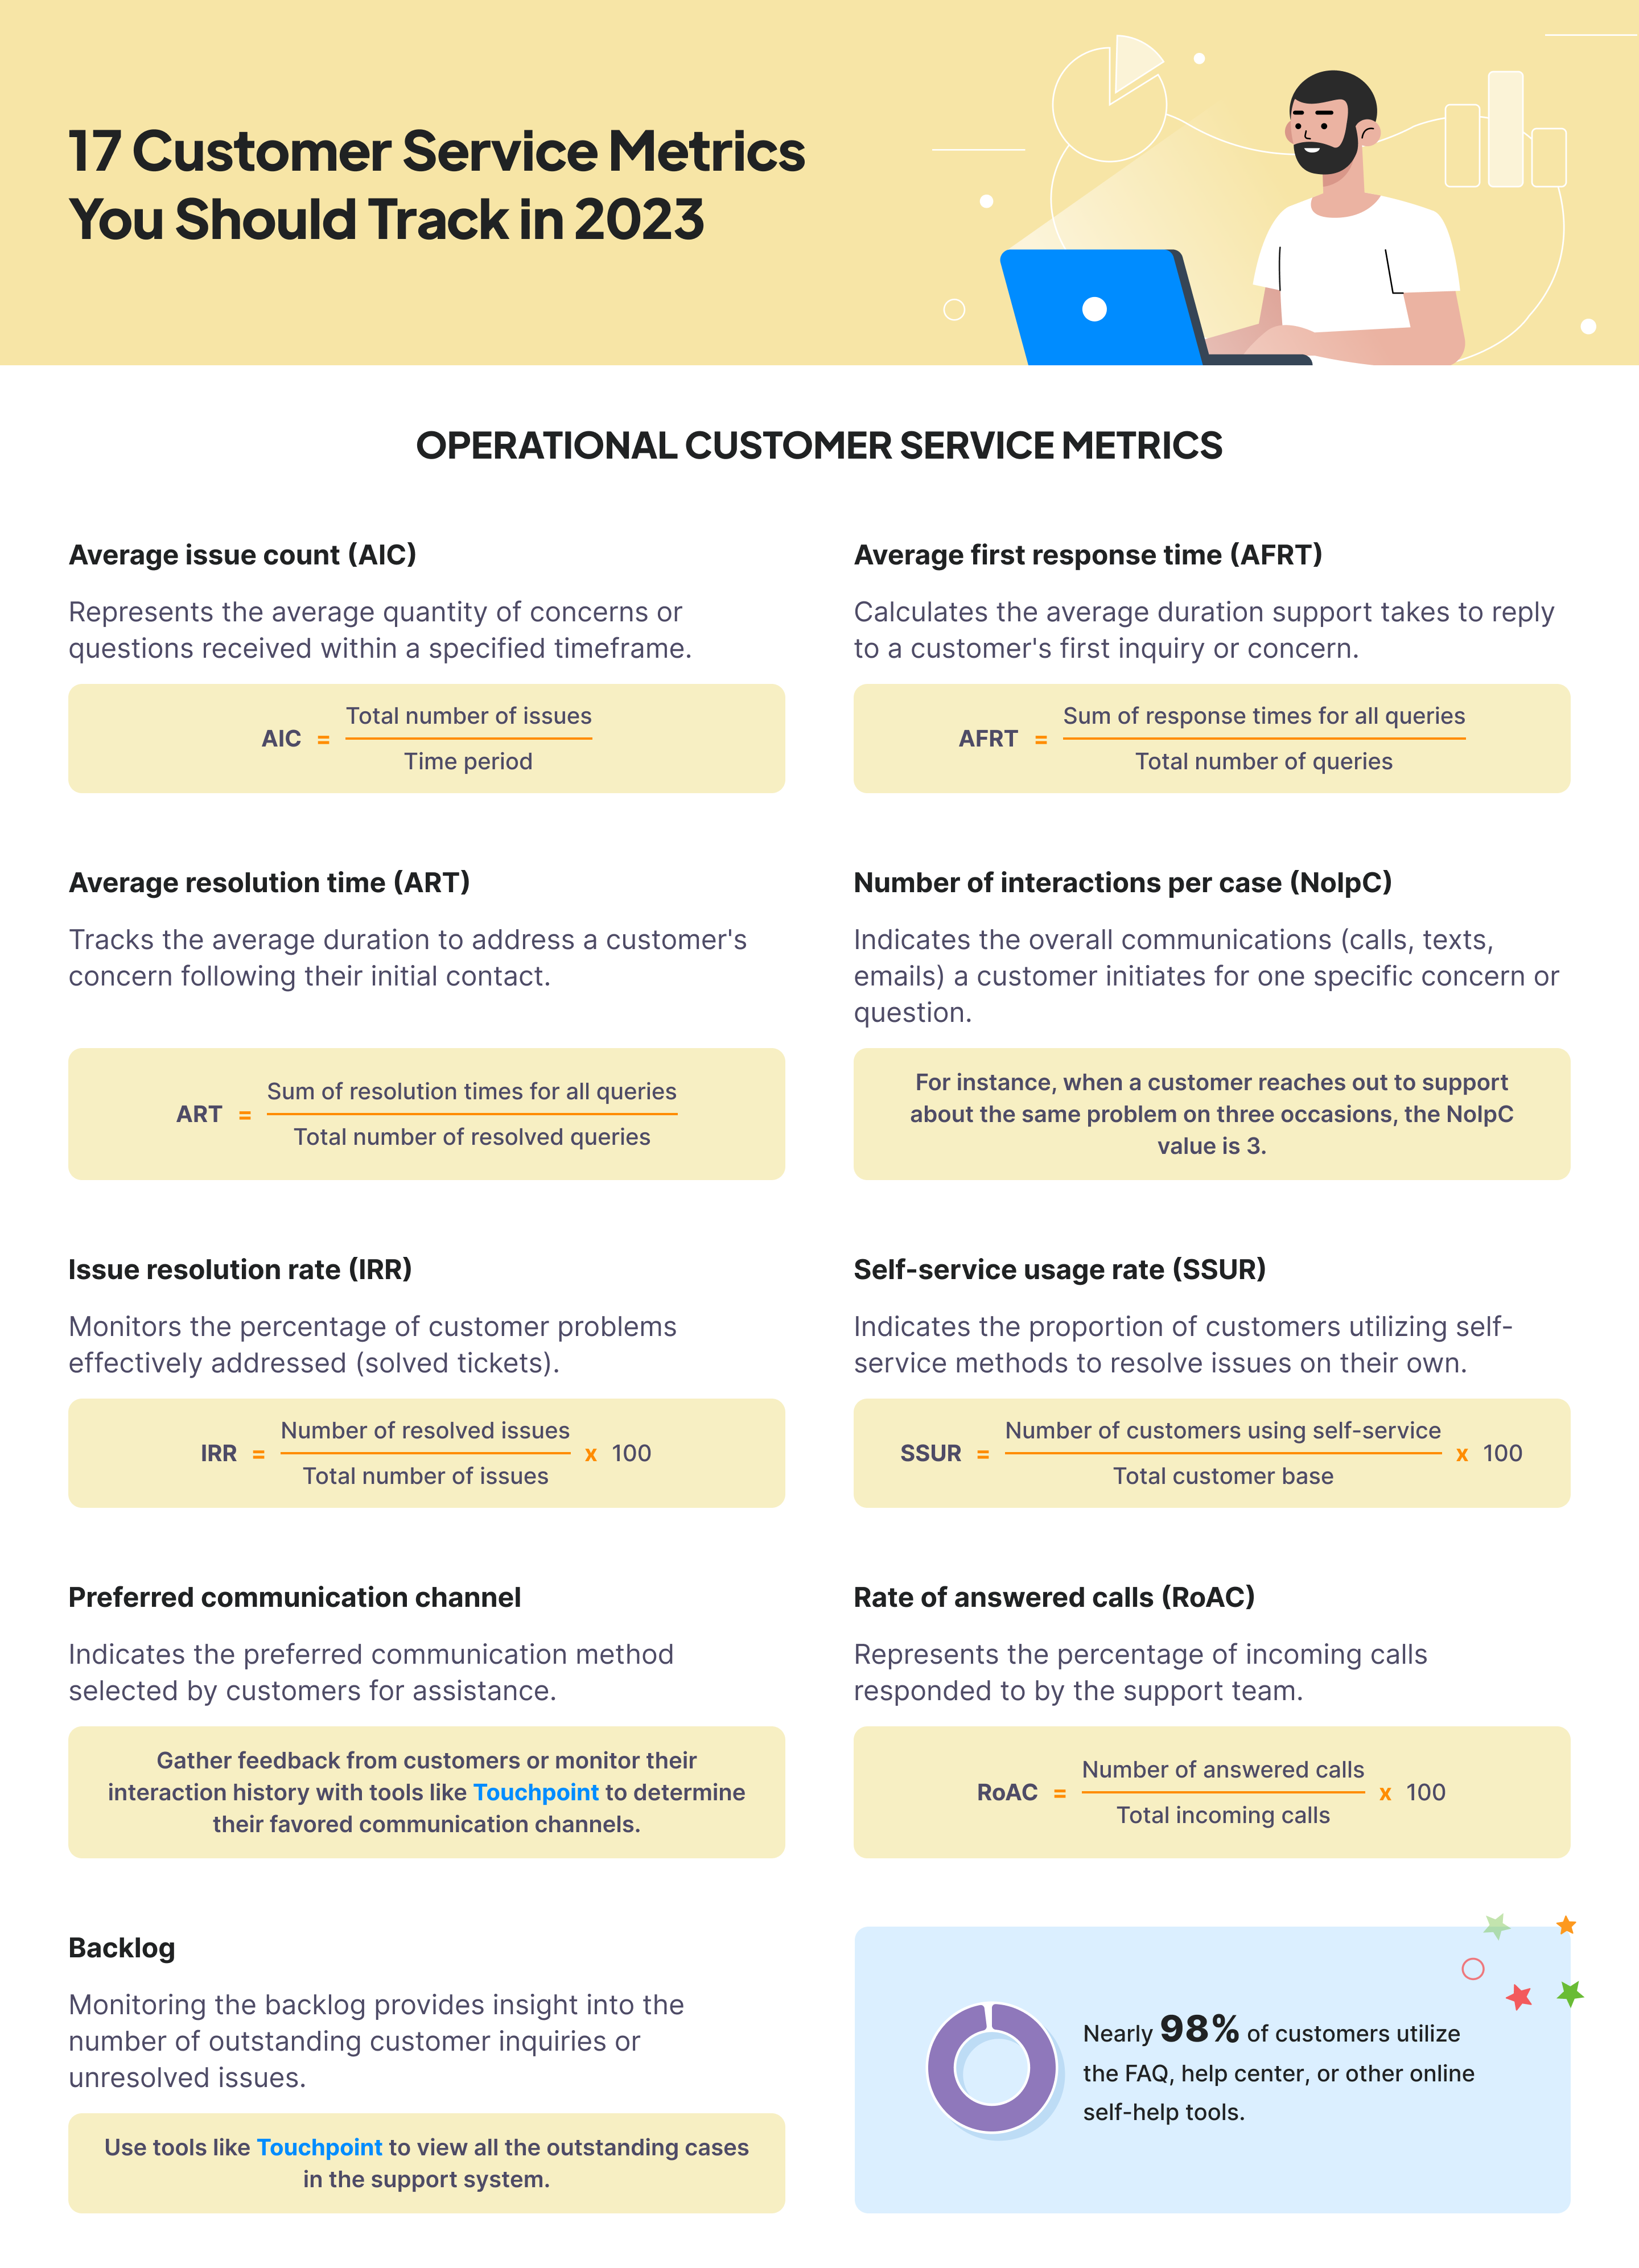
Operational customer service metrics
Operational customer service metrics are specific measurements used to assess the efficiency, effectiveness, and performance of customer service operations within a business.
These metrics provide quantifiable data about various aspects of customer service, allowing companies to evaluate how well they are managing customer interactions, resolving issues, and meeting the needs of their clientele.
Here are the key operational customer service metrics you need to monitor.
1. Average issue count (AIC)
The AIC measures the average number of issues or queries received over a defined period.
Why is AIC important?
AIC helps in understanding if customer issues are increasing or decreasing over time, indicating the effectiveness of support measures. A consistently high AIC might point to product/service shortcomings, emphasizing the need for improvements.
Regularly track AIC to identify long-term trends. Also, monitor AIC during marketing campaigns to assess their impact on customer inquiries and complaints.
How to calculate the AIC
Divide the total number of issues in a given period by the number of days in that period:

Example: 50 issues in a week / 7 days = 7.14 AIC per day.
Benchmark
The benchmark for this metric varies by industry. Monitoring for unusual spikes is crucial.
👍 Pro tip to improve: Streamline processes to reduce the number of repetitive issues.
2. Average first response time (AFRT)
The AFRT measures the average time the support team takes to respond to a customer’s initial inquiry or issue.
Why is AFRT important?
AFRT correlates with how fast issues are acknowledged, setting the pace for subsequent resolution times.
Use AFRT metrics during peak seasons or promotional events when customer inquiries are expected to surge.
How to calculate the AFRT
Calculate the sum of response times for all first customer interactions, then divide it by the total number of interactions:

Example: (10 minutes + 15 minutes + 5 minutes) / 3 interactions = 10 minutes AFRT.
Benchmark
Industry benchmarks may vary, especially across different channels:
- For live chat, a first response within 1 minute is optimal
- On social media, a prompt first response within a few minutes is typically expected
- For channels like emails, a slightly longer first response time, such as within a few hours or by the end of the business day, is acceptable
It’s important to research specific channel benchmarks for a more accurate comparison.
👍 Pro tip to improve: Use automated responses for acknowledgment and prioritize urgent queries for faster resolution.
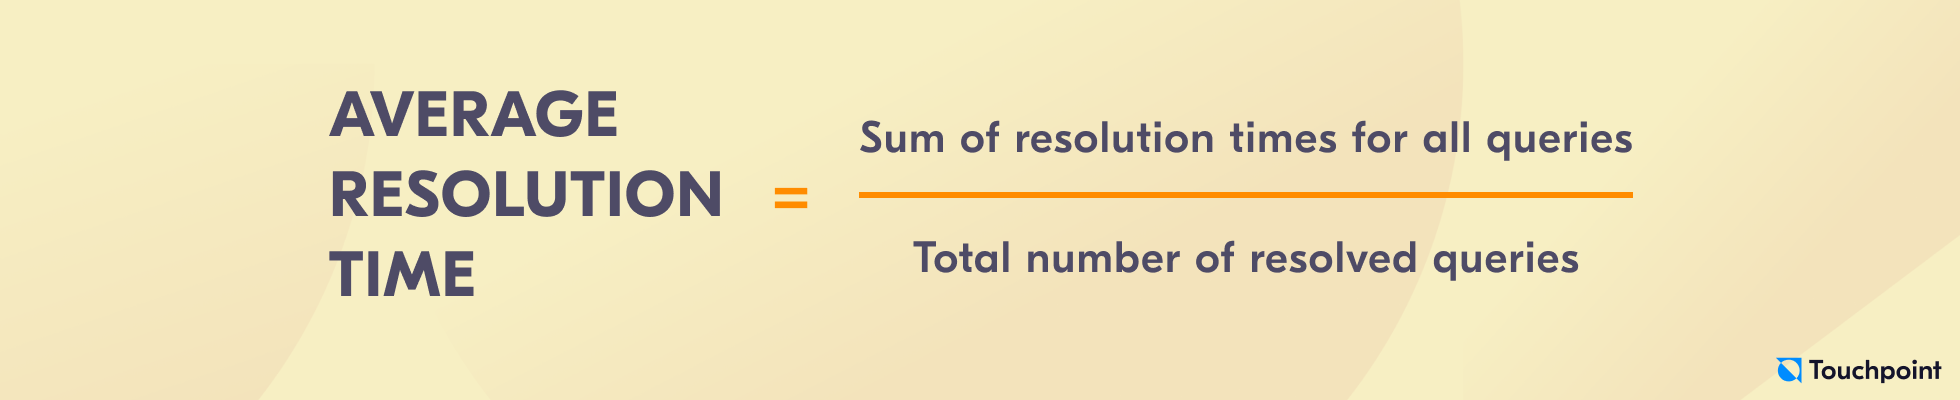
3. Average resolution time (ART)
The ART, also known as average handling time (AHT), measures the average time taken to resolve a customer’s issue after their first contact.
Why is ART important?
ART is a key factor in adhering to SLAs. Meeting or exceeding resolution time commitments enhances trust and reliability.
Measure ART after implementing changes in processes, tools, or systems to gauge the impact on resolution times and make necessary adjustments.
How to calculate the ART
Calculate the sum of resolution times for all queries, then divide it by the total number of resolved queries:
Example: (30 minutes + 45 minutes + 20 minutes) / 3 resolved queries = 31.67 minutes ART.
Benchmark
A typical ART is within 24 to 48 hours, depending on the issue’s complexity.
👍 Pro tip to improve: Leverage automation and canned responses to swiftly resolve common queries.
4. Number of interactions per case (NoIpC)
The NoIpC reflects the total interactions (calls, messages, emails) a customer makes for a single issue or query.
Why is NoIpC important?
Understanding the number of interactions per case assists in allocating appropriate resources, whether it’s additional training for agents or investing in self-service options.
Evaluate NoIpC regularly to identify cases with a higher interaction count.
How to calculate the NoIpC
Count all interactions (across different channels) related to a specific case.
Example: A customer contacts support three times regarding the same issue, so the NoIpC is 3.
Benchmark
NoIpC benchmarks are industry-specific, as they depend on how many details should be included in the initial ticket sent by the customers. However, try to aim for a lower NoIpC. That indicates efficient issue resolution in fewer attempts.
👍 Pro tips to improve:
- Train support agents to comprehensively address concerns in the first interaction to minimize repeated customer contacts.
- Compare this metric across your support team. If significant differences are found between agents, it might be necessary to address the matter at an individual level.
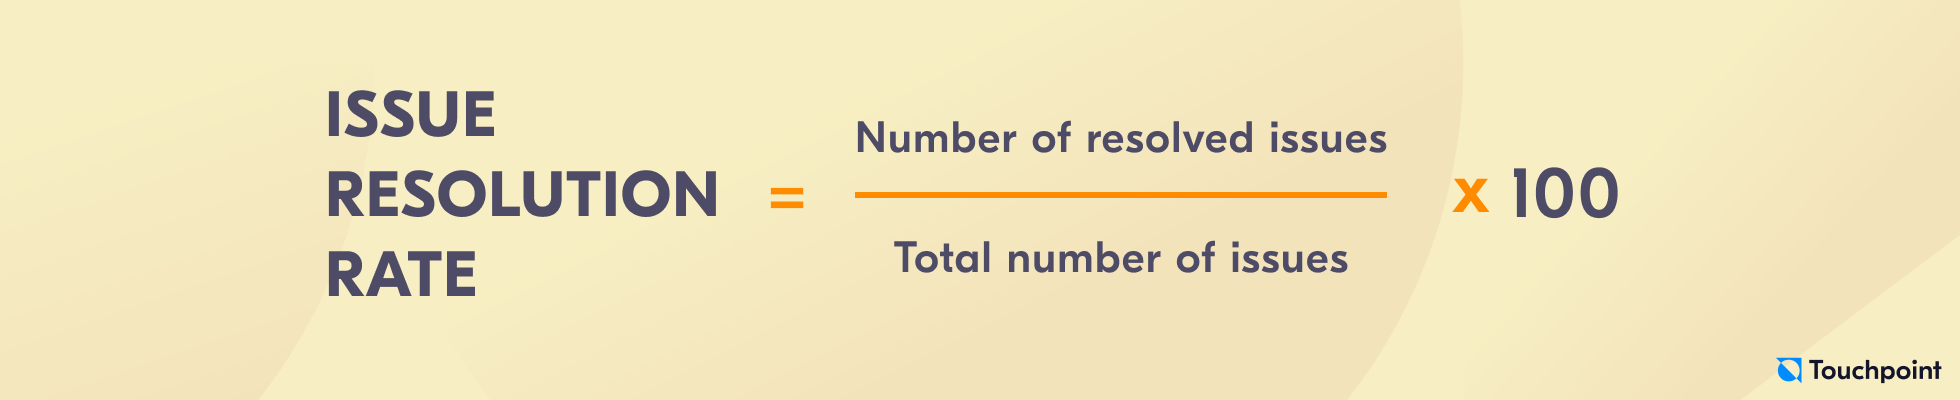
5. Issue resolution rate (IRR)
The IRR tracks the percentage of customer issues that are successfully resolved (ticket is closed).
Why is IRR important?
Monitoring IRR helps in identifying areas for improvement in the support process.
After implementing changes in support processes or systems, monitor IRR to evaluate the impact of these changes on issue resolution efficiency.
How to calculate the IRR
Divide the number of resolved issues by the total number of issues, then multiply by 100 to get the percentage:
Example: 80 resolved issues / 100 total issues = 80% IRR.
Benchmark
Aim for a high IRR, ideally above 90%.
👍 Pro tip to improve: Enhance product knowledge and troubleshooting skills among the support team.
6. Self-service usage rate (SSUR)
The SSUR represents the percentage of customers using self-service options to find solutions independently.
Why is SSUR important?
Self-service options are often more cost-effective than traditional support channels. A high SSUR suggests cost savings due to reduced direct support interactions.
Compare SSUR across different time frames or against competitors to understand the evolution of self-service usage.
How to calculate the SSUR
Divide the number of self-service users by the total customer base, then multiply by 100 to get a percentage:

Example: 500 customers used self-service / 1000 total customers = 50% SSUR.
Benchmark
Aim for a high SSUR, which indicates your self-help options are effective.
👍 Pro tip to improve: Optimize self-service platforms and promote them actively to encourage customer utilization.
7. Preferred communication channel
The preferred communication channel reflects the most favored communication channel chosen by customers for support.
Why is the preferred communication channel important?
Knowing the favored communication channel helps in allocating resources effectively, ensuring that the support team is available and proficient in the channels most commonly used by customers.
Utilize the information on preferred channels to segment customers.
How to determine the preferred communication channel
Collect customer feedback or track their interaction history to identify their preferred channels.
Example: Let’s say you’re assessing the proportion of support requests handled through live chat compared to the total number of support requests in a month.

- Live chat support requests: 500
- Total support requests (all channels): 2000
Therefore, in this case:
Live chat usage rate = (500/2000) x 100 = 25%
Insight
Understanding preferred channels helps you tailor support strategies to customer preferences.
👍Pro tip to improve: Offer support through the most favored channels to enhance customer engagement and satisfaction.
8. Rate of answered calls (RoAC)
The RoAC indicates the percentage of incoming calls that are answered by the support team.
Why is RoAC important?
Monitoring RoAC helps in identifying periods of high call volumes and optimizing staffing levels.
Compare RoAC across different time frames or against industry benchmarks to identify trends and areas for improvement in call center efficiency.
How to calculate the RoAC
Divide the number of answered calls by the total incoming calls, then multiply by 100 to obtain a percentage:

Example: 400 answered calls / 500 total incoming calls = 80% RoAC.
Benchmark
Aim for a high RoAC, ideally above 90%.
👍 Pro tip to improve: Optimize staffing and scheduling to manage call volumes effectively.
9. Backlog
Tracking the backlog offers insights into the number of unresolved customer queries or issues pending resolution.
Why is backlog important?
Analyzing the backlog helps in identifying patterns or bottlenecks in the support process.
Evaluate backlog after busy periods (e.g., promotions, holidays) to determine if additional resources are needed to clear the accumulated backlog efficiently.
How to determine the number of unresolved issues
Count the total unresolved cases in the support system.
Insight
An increasing backlog trend could indicate the necessity for additional support resources or process enhancements.
👍 Pro tips to improve:
- Observe patterns and assess if the team is adequately staffed during specific periods.
- Leverage modern AI technologies for extra assistance.
- Implement effective ticket management and prioritize backlog resolution based on issue severity.
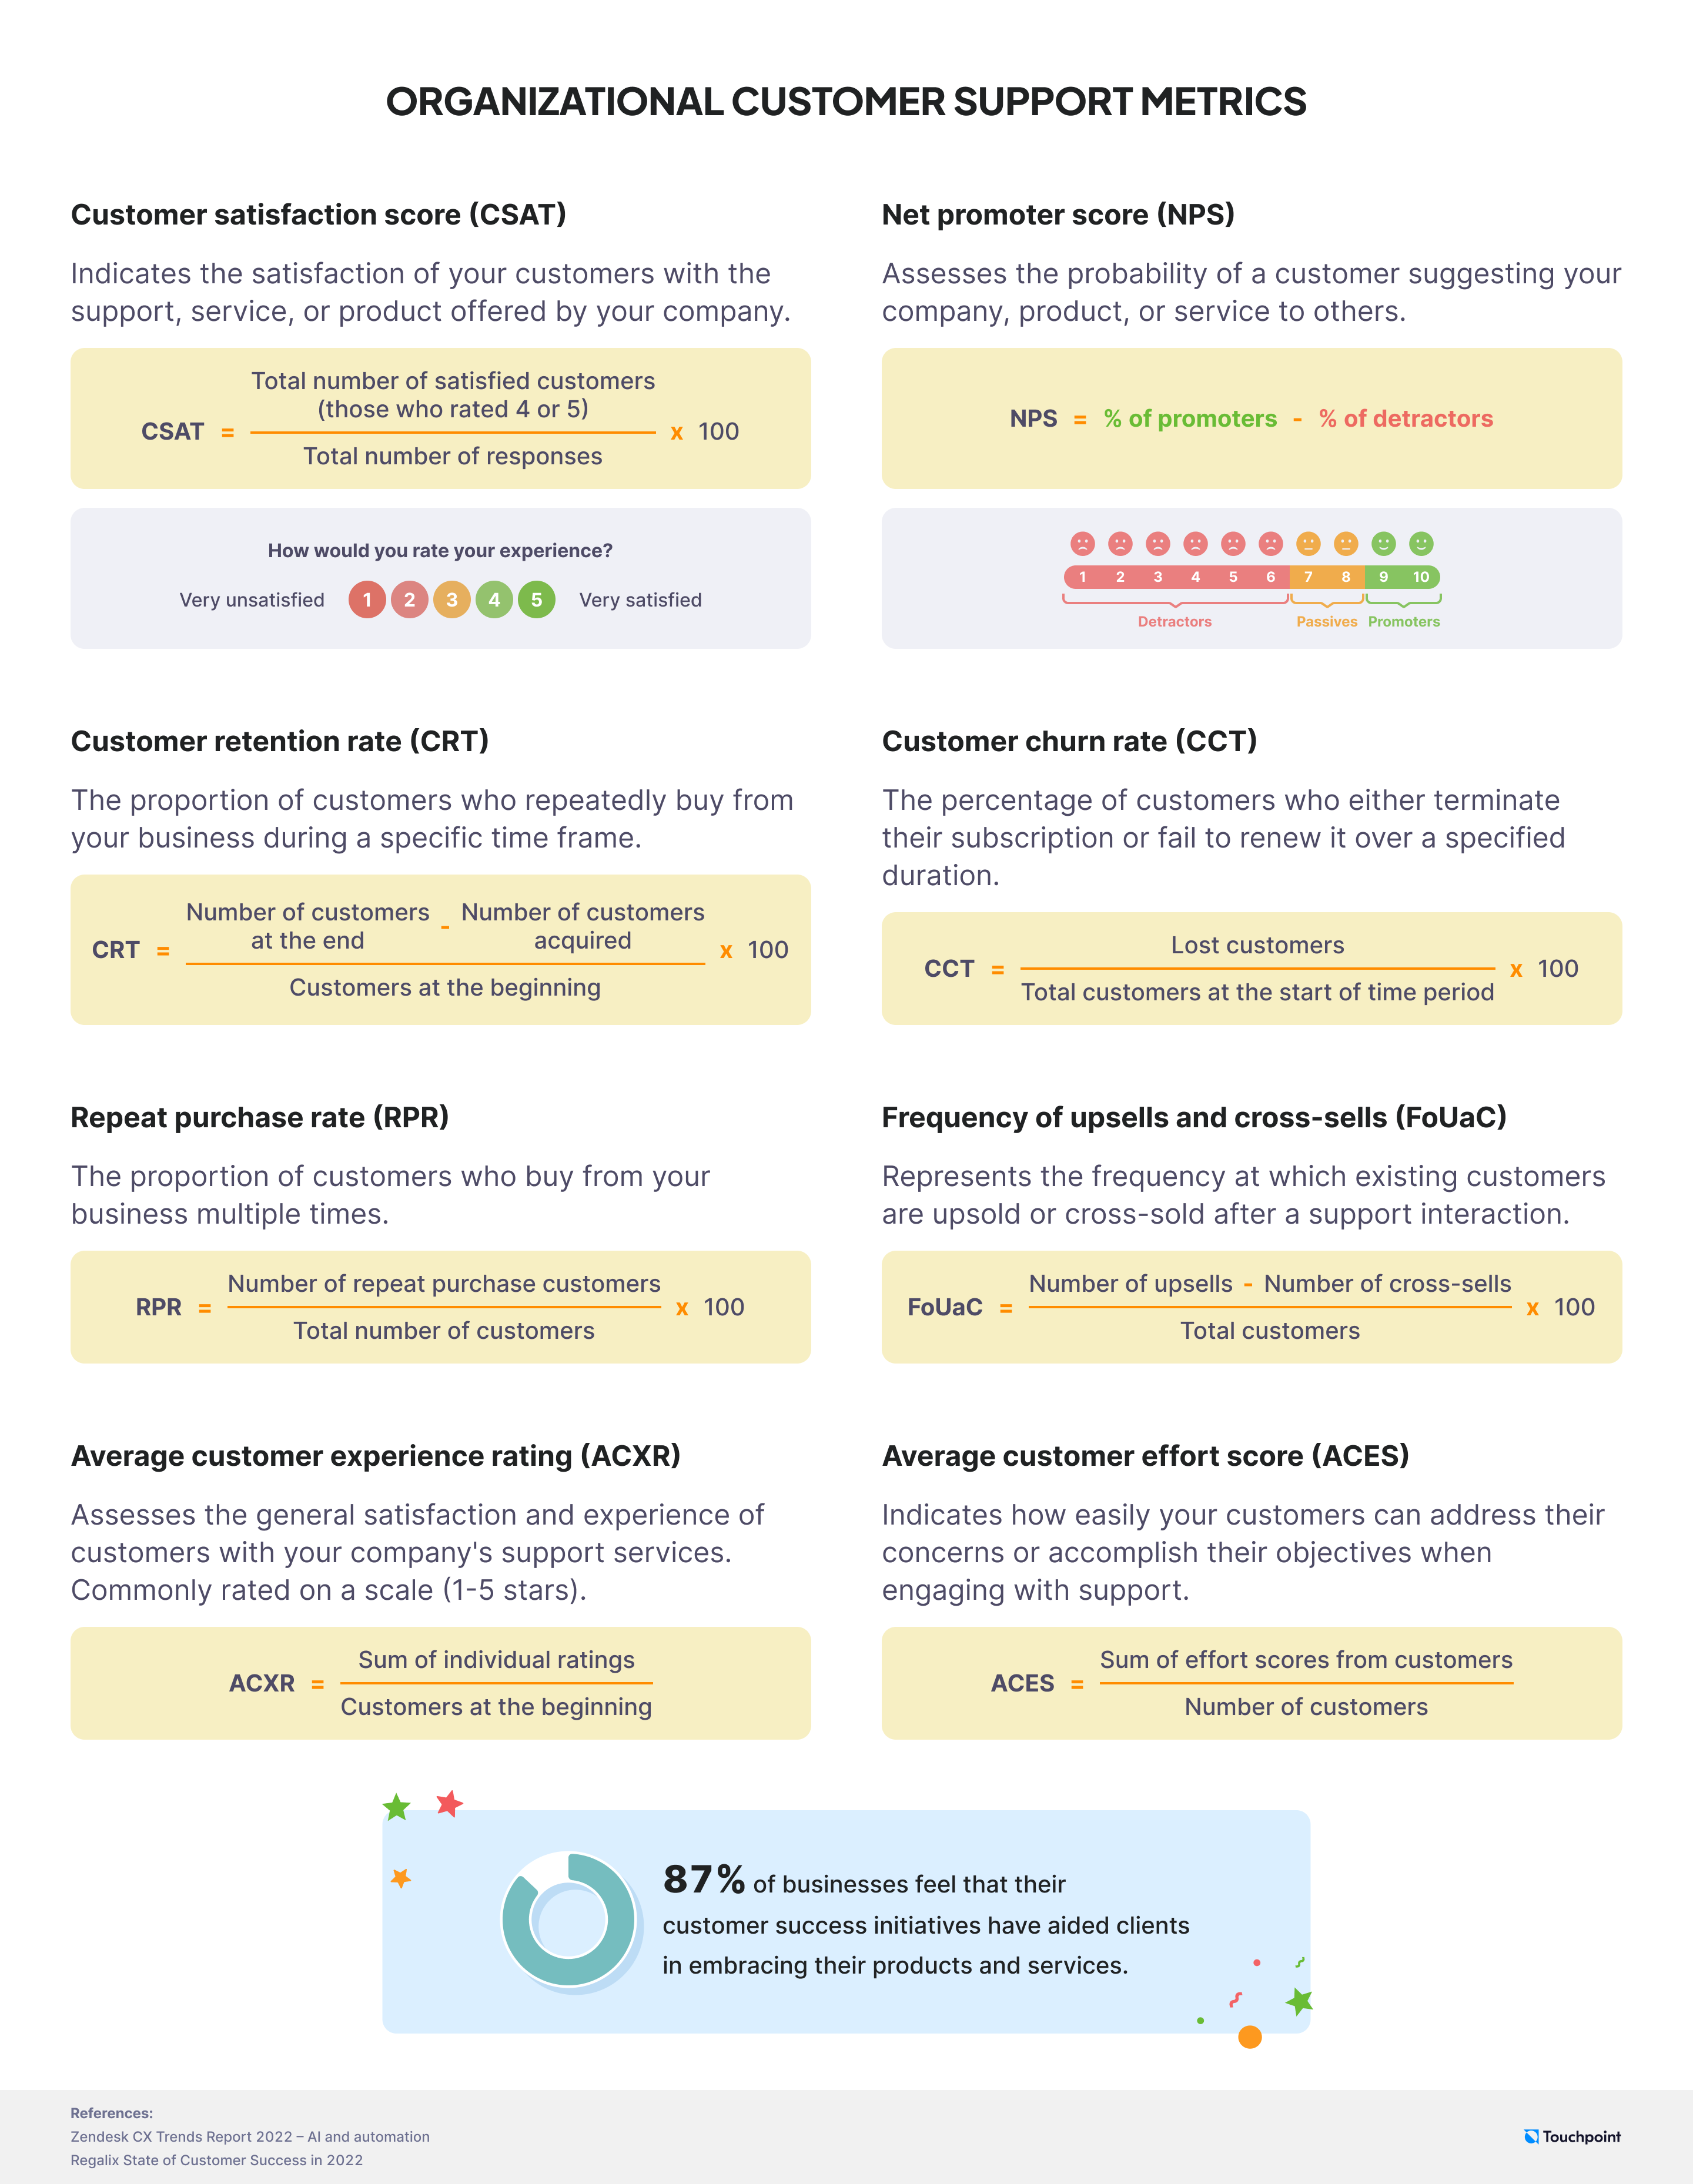
Organizational customer support metrics
Organizational customer support metrics are standardized measures that a company uses to evaluate the performance and efficiency of its customer support services.
These metrics include the net promoter score, customer satisfaction levels, upsells and cross-sells, and more.
We already covered the below organizational customer support metrics in our customer success metrics article:
- Customer satisfaction score (CSAT)
- Net promoter score (NPS)
- Customer retention rate
- Customer churn rate
- Repeat purchase rate
We will expand on the remaining organizational customer support metrics here.
10. Frequency of upsells and cross-sells (FoUaC)
The FoUaC indicates how often additional products or services are sold to existing customers (upsells) or related products are offered to customers (cross-sells) as a result of a support interaction.
Why is FoUaC important?
Tracking FoUaC helps maximize customer lifetime value by encouraging additional purchases.
Monitor FoUaC during new product launches or updates to assess the effectiveness of upselling complementary products or features.
How to calculate the FoUaC
Calculate the total number of upsells and cross-sells in a given period and divide it by the total number of customers. Then multiply by 100 to obtain the percentage:

Example: [(25 upsells + 25 cross-sells) / 1000 customers] x 100 = 5% FoUaC.
Benchmark
This is industry-specific, but aim for a steady increase over time.
👍 Pro tip to improve: Train customer service representatives to identify upselling and cross-selling opportunities during customer interactions.
11. Average customer experience rating (ACXR)
The ACXR measures the overall satisfaction and experience of customers with the organization’s support services. It is often rated on a scale (e.g., 1–5 stars).
Why is ACXR important?
ACXR offers a standardized way to benchmark performance over time, enabling businesses to track improvements or declines in customer satisfaction.
Collect ACXR after customer interactions, transactions, or service engagements to evaluate immediate customer satisfaction.
How to calculate the ACXR
Calculate the sum of all ratings, then divide it by the total number of customers who provided ratings:

Example: (4 stars + 5 stars + 3 stars) / 3 customers = 4.0 ACXR.
Benchmark
On a scale from 1 to 5, aim for an average rating of 4 or higher for a positive customer experience.
👍 Pro tip to improve: Gather detailed feedback and address the areas customers highlight for improvement.
12. Average customer effort score (ACES)
The ACES reflects the ease with which customers can resolve their issues or achieve their goals when interacting with customer support.
Why is ACES important?
Studies show that customers with low-effort experiences are more likely to become loyal, making ACES a predictor of customer advocacy.
Gather ACES after customers use your website or app to pinpoint areas where user experience can be enhanced.
How to calculate the ACES
Ask customers to rate their agreement with a statement like, “The company made it easy for me to handle my issue,” on a scale (e.g., 1–7). Then, calculate the average score:

Example: (6 + 3 + 7 + 5 + 5 (scores out of 7) / 5 respondents) = 5.2 ACES.
Benchmark
Higher scores indicate higher ease. If you are going to use a scale from 1 to 7, aim for a score of 5 or higher.
👍 Pro tip to improve: Simplify processes and interactions to reduce customer effort.
Related articles

62 Customer service email templates for every situation
Clients expect fast and reliable service that meets ...

How to deal with angry customers: 10 Strategies and scripts that work
An angry customer isn’t just a bad day. It’s a fork ...

From ADKAR to PDCA: 10 Essential change management models for business success
Struggling to deal with change of any type might be ...

Building customer loyalty: Strategies to retain customers
In today’s highly competitive business environment, ...

3 Easy Google Calendar SMS reminder automations with Textmagic and Zapier
Managing schedules has become effortless thanks to d...